Topic 2. Measurement techniques

Click to Download Heinemann Measurement
|
|
|

|
|
|
Click on the icon to try the simulation
Click on the Icon to Download the Simulation
Click on the Icon to Download the Simulation
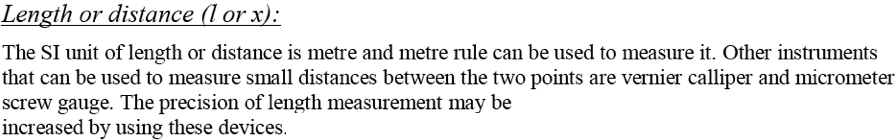
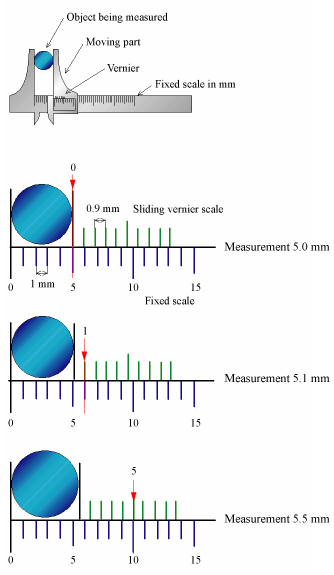
Vernier CaliperThe vernier caliper is commonly used for accurate measurement of up to 0.1 mm. They are 4 steps to measure length of an object using the vernier caliper.
Step 1: Grip the object gently using the outside jaws of the calipers.
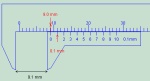
Step 2: Read the main scale directly opposite the zero. In this case, the reading on the main scale is 22 mm. Step 3: The 6th vernier mark coincides with a marking on the main scale. This gives a reading of +0.6 mm to be added to the main scale reading. Step 4: The length is found by adding the main scale and vernier scale reading, i.e. 22 + 0.6 = 22.6 mm Micrometer Screw GaugeMicrometer Screw Gauge
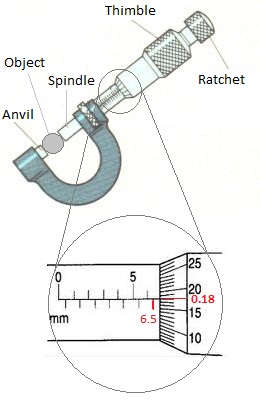
The micrometer screw gauge is able to give very accurate measurements of length, up to 25 mm. It has an accuracy of 0.01 mm. The procedure of measuring length of an object is as follows.
Step 1: Turn the thimble until the anvil and the spindle gently grip the object. Then turn the ratchet until it starts to click.
Step 2: Read the main scale reading at the edge of the thimble, i.e. 6.5 mm. Step 3: The thimble scale has 50 divisions, each of which is equal to 0.01 mm. Take the thimble reading opposite the datum line of the main scale, i.e. 18 divisions, which gives 0.18 mm. Step 4: The length is found by adding the main scale and thimble scale reading, i.e. 6.5 + 0.18 = 6.68 mm. |
NTNU Java: Vernier Caliper
This EJS based applet simulates a Vernier Caliper. The user can perform all measurements that are typically done with a caliper. Micrometer Model
This interactive simulation gives students practice in the operation and the physical parts of a real micrometer, a measuring device that employs a screw to amplify distances that are too small to measure easily. Vector Addition Model
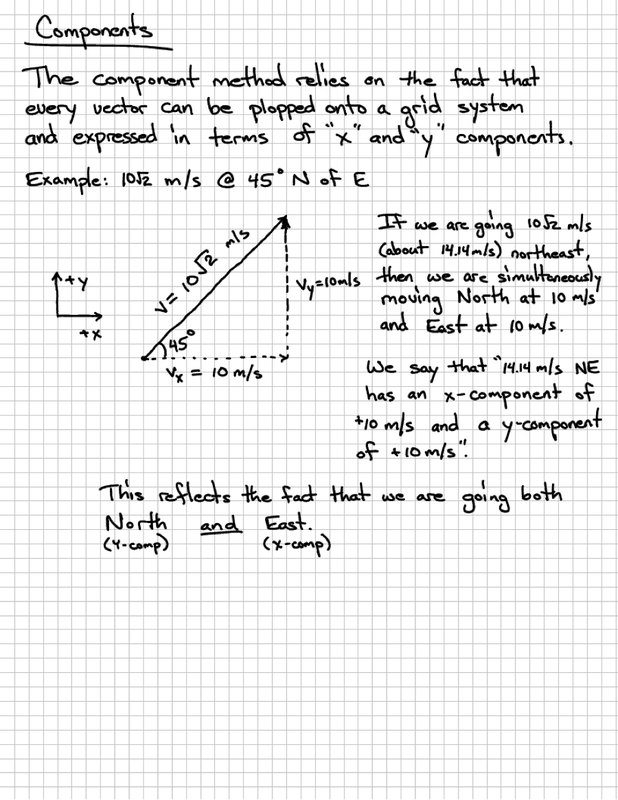
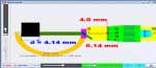
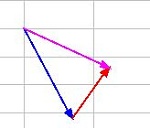
This simulation gives students a chance to practice two-dimensional vector addition in an interactive format with immediate feedback. The magnitude and direction of two vectors are given; the students' task is to determine x and y components, length of the two vectors, and the resultant sum. 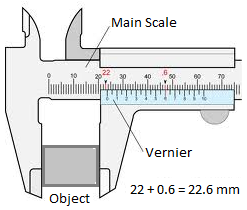
|
Random error: is the type of error which causes readings to scatter about the true value.
Systematic error: is the type of error which causes readings to deviate in one direction from the true value.
Precision: refers to the degree of agreement (scatter, spread) of repeated measurements of the same quantity. {NB: regardless of whether or not they are correct.}
Accuracy: refers to the degree of agreement between the result of a measurement and the true value of the quantity.
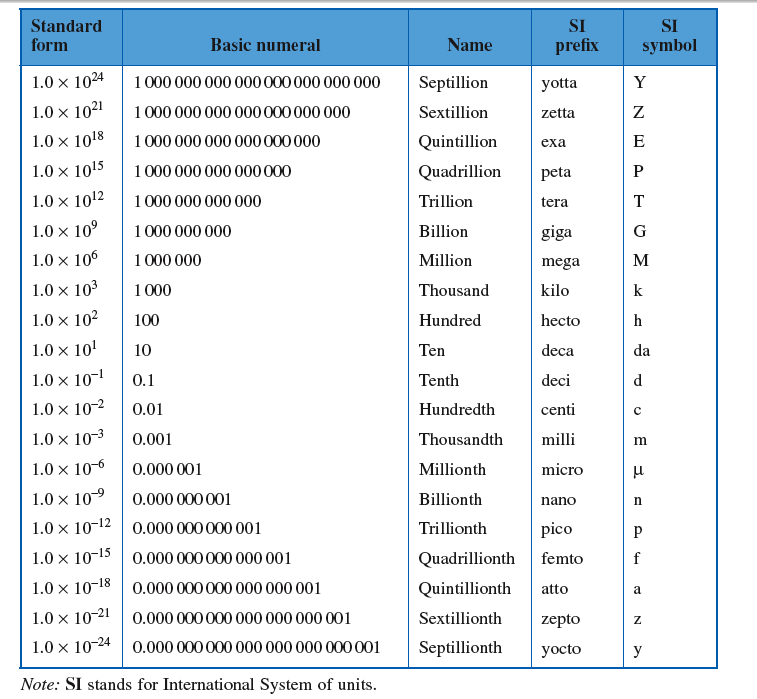
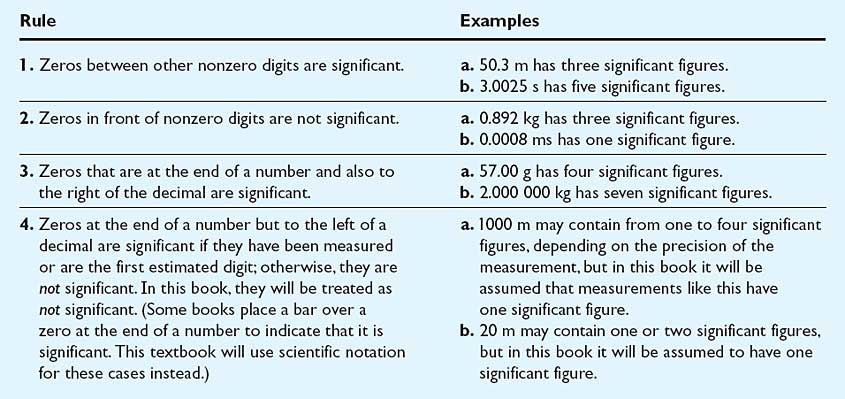
Significant Figures

Uncertainty of measurement
Absolute uncertainty
No physical quantity can be measured with 100% accuracy. Experimental quantities will be measured as a range of measurements. They should be expressed as the centre point of the range (or average value) ± half the range of readings. This value is the absolute uncertainty.
e.g. readings taken from 90.0 cm to 90.4 cm should be expressed as 90.2 ± 0.2 cm.
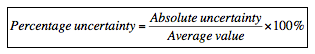
Percentage uncertainty
This is calculated as a percentage of the absolute uncertainty of the average value. The equation is therefore:
No physical quantity can be measured with 100% accuracy. Experimental quantities will be measured as a range of measurements. They should be expressed as the centre point of the range (or average value) ± half the range of readings. This value is the absolute uncertainty.
e.g. readings taken from 90.0 cm to 90.4 cm should be expressed as 90.2 ± 0.2 cm.
Percentage uncertainty
This is calculated as a percentage of the absolute uncertainty of the average value. The equation is therefore:
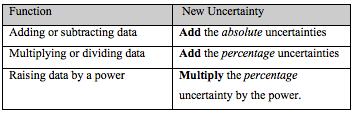
Combining uncertainties
When calculating values that rely on experimental data, errors have the possibility to increase. For example, when calculating density, given density = mass / volume, if the mass is 1% too large and the volume is 1% too small, the density will be 2% too large. Follow the rules in this table for compounding uncertainties.
When calculating values that rely on experimental data, errors have the possibility to increase. For example, when calculating density, given density = mass / volume, if the mass is 1% too large and the volume is 1% too small, the density will be 2% too large. Follow the rules in this table for compounding uncertainties.
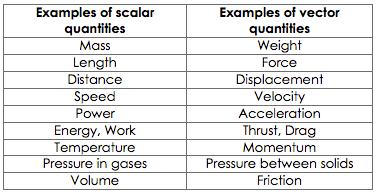
Vectors & Scalars
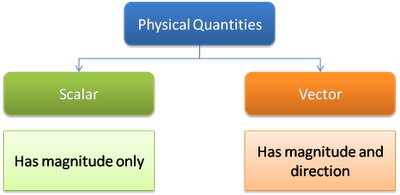
A scalar quantity has a magnitude only. It is completely described by a certain number and a unit.Examples include: Distance, speed, mass, time, temperature, work done, kinetic energy, pressure, power, electric charge etc.
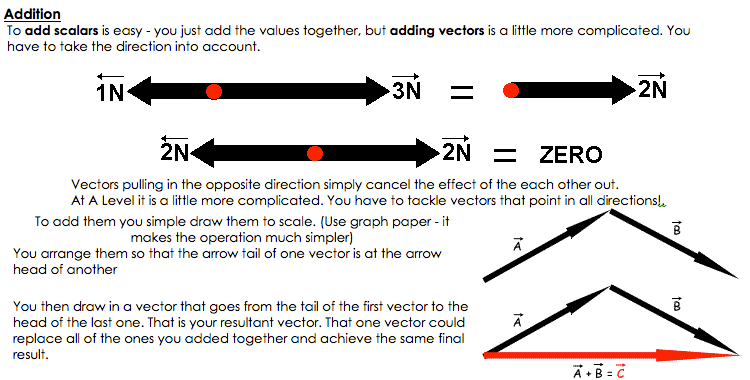
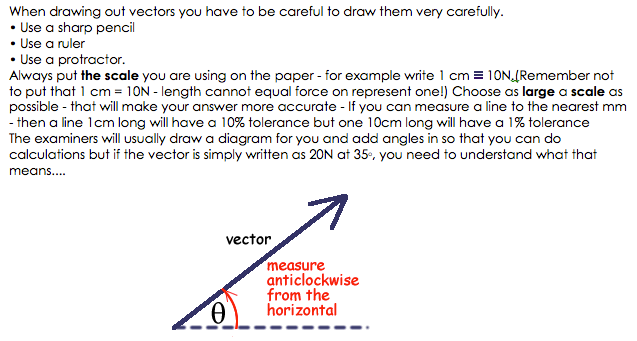
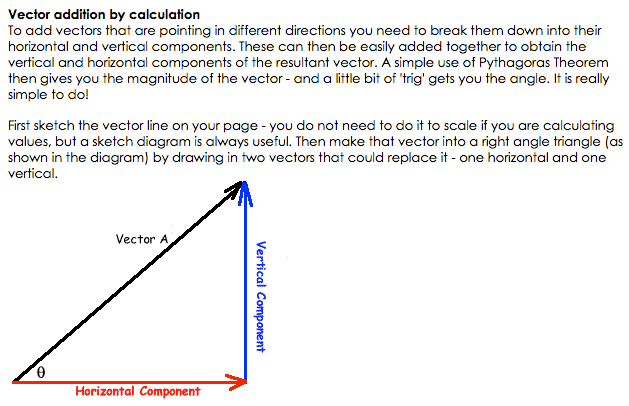
A vector quantity has both magnitude and direction. It can be described by an arrow whose length represents the magnitude of the vector and the arrow-head represents the direction of the vector.
Examples include: Displacement, velocity, moments (or torque), momentum, force, electric field etc.
A vector quantity has both magnitude and direction. It can be described by an arrow whose length represents the magnitude of the vector and the arrow-head represents the direction of the vector.
Examples include: Displacement, velocity, moments (or torque), momentum, force, electric field etc.